
What you need to know to get it right!
Introduction to remote sensing
For whom? This article addresses professionals like foresters, ecologists, project developers, certifiers, and environmentalists (in the following called natural resources managers) who are new to the field of remote sensing or who want to update their basic knowledge.
What will you learn? You will learn to
- distinguish between various data collection methodologies,
- understand the pros and cons of different data sources, and
- select the right data set to answer your questions efficiently.
Demand for remote sensing service: When working in sustainable resource management such as forest landscape management (e. g. forestry, conservation, forest certification, agroforestry), remote sensing applications have become a valuable information source to support management decision making.
Remote sensing: In contrast to the personal on-site observation, remote sensing is information acquisition about an object or a phenomenon without making physical contact with it. Its advantage is the ability to efficiently collect data of large, inaccessible and remote landscapes such as forests.
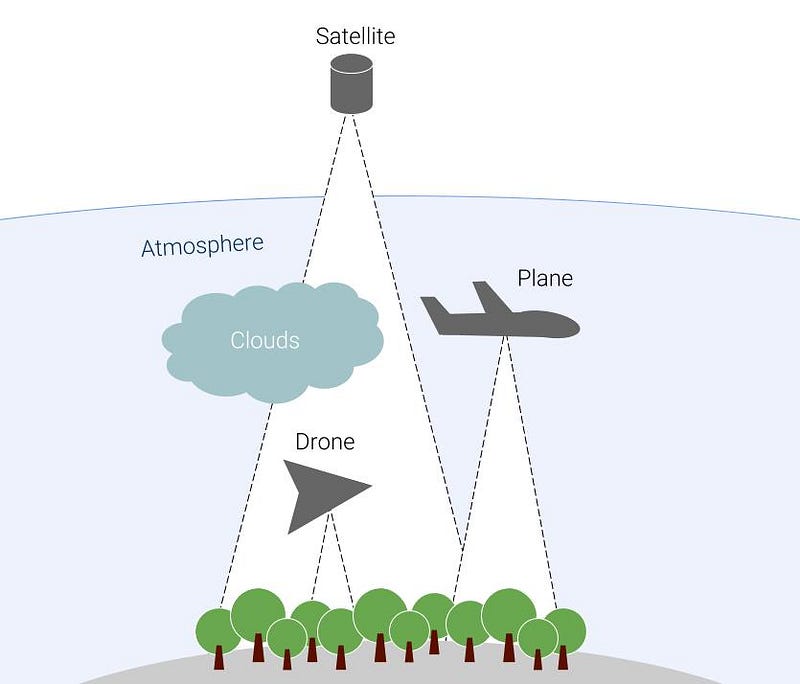
Sensor positioning: Remote sensing is carried out using a wide range of different sensors and methodologies. Carriers like satellites, planes, and more recently also civil drones — also known as Unmanned Aerial Vehicles (UAVs) — can be equipped with one or multiple sensor types.
The sensor altitude and its speed has a significant impact on the data resolution and quality as well as timing and spatial coverage. For example, satellites like Sentinel and Landsat can capture with on single shoot (scene) several thousands of hectares. Every week they are able to cover the entire world with a resolution of 10 to 30 meters per pixel image resolution. In comparison, standard drones like, fixed wing drones in the lower to medium price segment, might only capture up to 1.000–3.000 hectares per day, though, at an astonishing high resolution of about 5–20 cm per pixel and with guaranteed zero percent cloud coverage or atmospheric interferences. This is a great advantage, especially in the cloud rich tropics.
Active or passive sensors: Besides the detection of reflected sunlight which is sensed by so-called passive sensors, active sensors actively send a signal and detect its reflection by an object.
Passive sensors collect light reflections in the bands of ultraviolet, visible light (for a human), near infrared and thermal infrared. Whereas active sensors like LIDAR or Radar send and receive for example near-infrared pulsed laser light or microwave data.
The following figure provides an overview of the extension of the electromagnetic spectra used in the field of remote sensing. It is divided into five typical wavelength bands. Ultraviolet, visible light (for a human), near infrared, thermal infrared and microwave.

Passivesensors make use of the fact, that different objects reflect in a different electromagnetic frequencies. This can be for example the visible light spectrum, that can be captured with an ordinary photo camera that is sensitive to red, green and blue (RGB). However, many sensors are also sensitive to spectra like ultraviolet light or near-infrared which are invisible to the human eye.
For example, the chlorophyll of healthy tree leaves specifically reflects sunlight in the near-infrared spectral region (which carries approximately half of the total incoming solar energy) to avoid overheating and damaging of the tissue.
If pests, disease, water, or nutrient stress cause damage to the chlorophyll, the near-infrared reflection is reduced. Multispectral cameras can sense this change before it becomes obvious in the visible light spectrum.
3D-information: Beside the spectral information many remote sensing analyses requires three-dimensional information about the surface of the study area. These Digital Surface Models (DSMs) can be acquired by the following methodologies.
- Photogrammetry: by using two or more photographic images of the same object, taken from different positions, it is possible to determine the three-dimensional coordinates of points of an object and hence reconstruct a 3D-surface.
- Lidar (Light Detection and Ranging): Lidar is a remote sensing surveying method mostly conducted from planes and more recently also from drones. The distance to the surface is measured by illuminating the target with a pulsed laser light and then remeasuring the return times and wavelengths. The resulting point cloud is used to reconstruct a 3-D representation of the surface.
- IFSAR (Interferometric Synthetic Aperture Radar): The sensor transmits a microwave (radio) signal towards a target and detects the back-scattered radiation. Based on these echoes high-resolution image data and surface models can be produced.
Applications in Natural Resources Management
After this necessary introduction into the technology and methodologies of remote sensing, the following list should provide and an idea of the potential scope of remote sensing applications for natural resources management:
- Land cover analysis
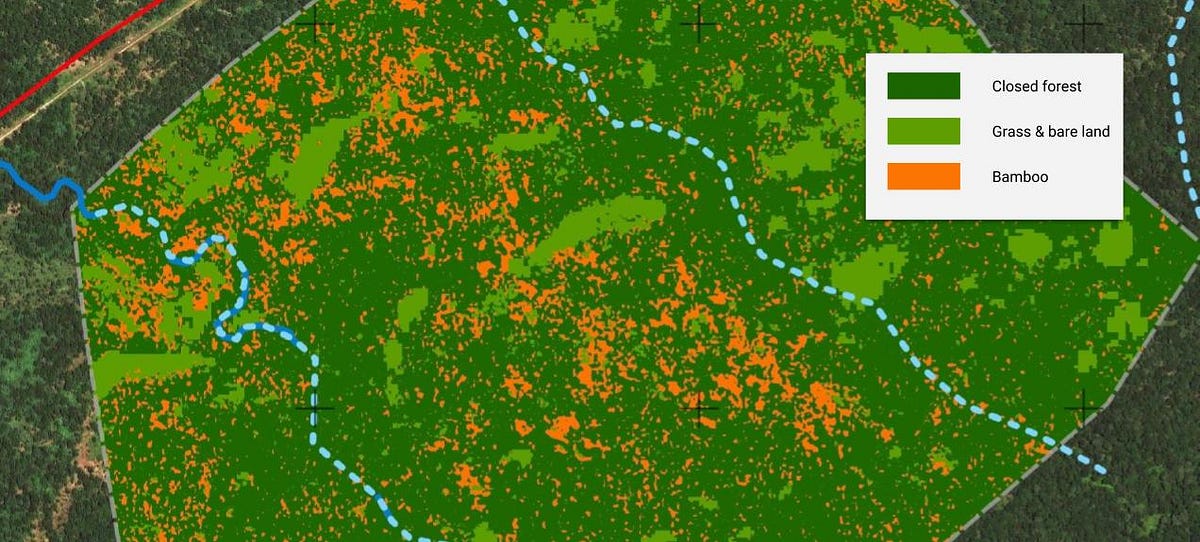
- Land-use change detection
- Distribution of timber resources
- Determination of carbon stock
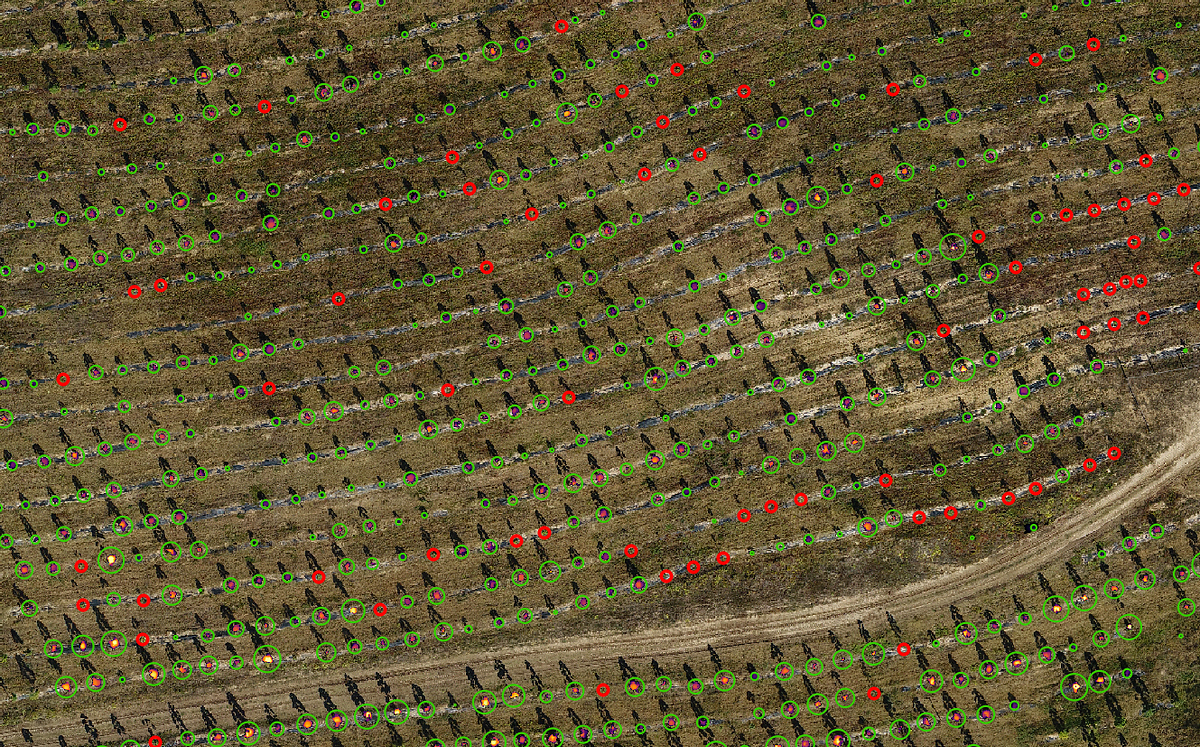
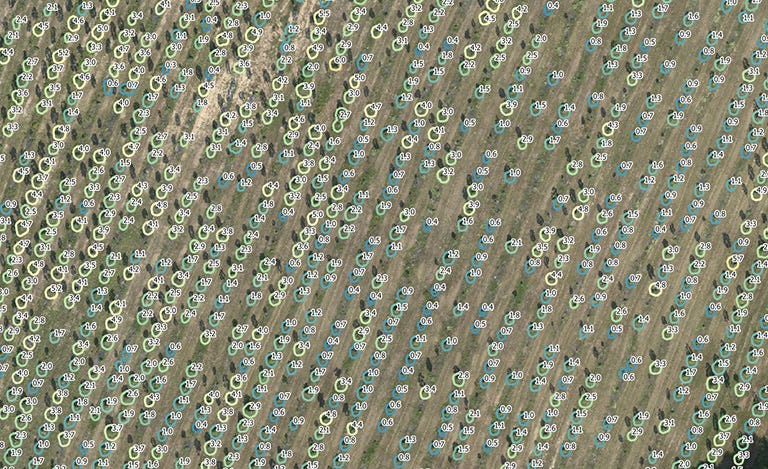
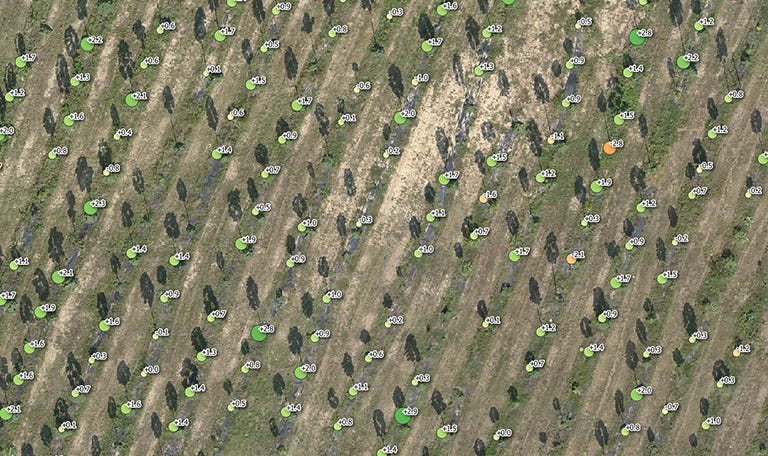
- Tree detection for automated forest inventories
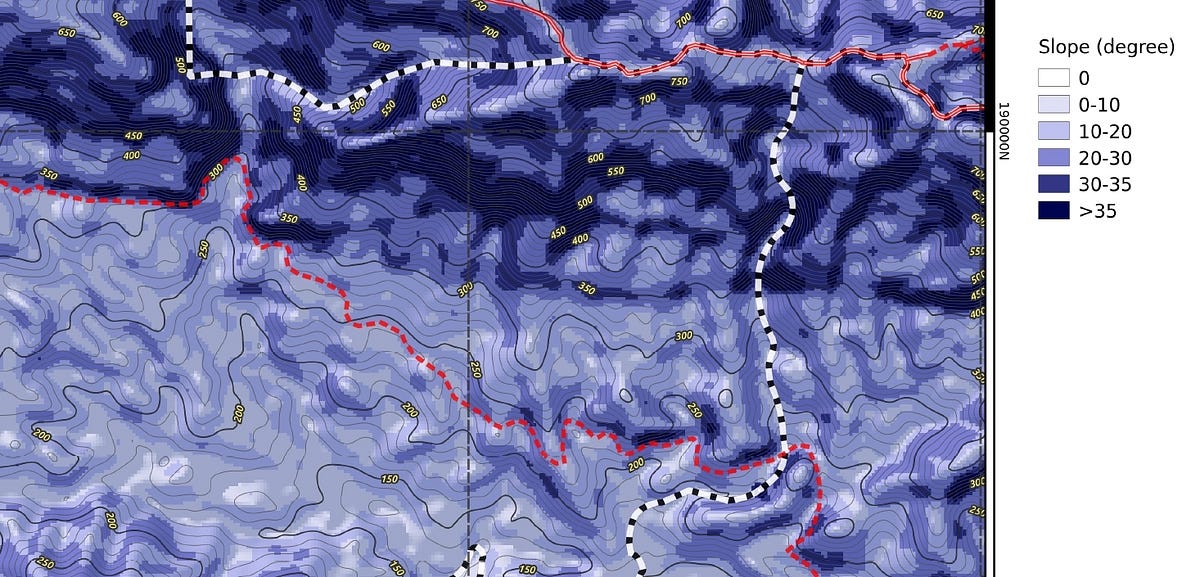
- Analyses of slope steepness
- High-resolution orthophoto maps for visual interpretation
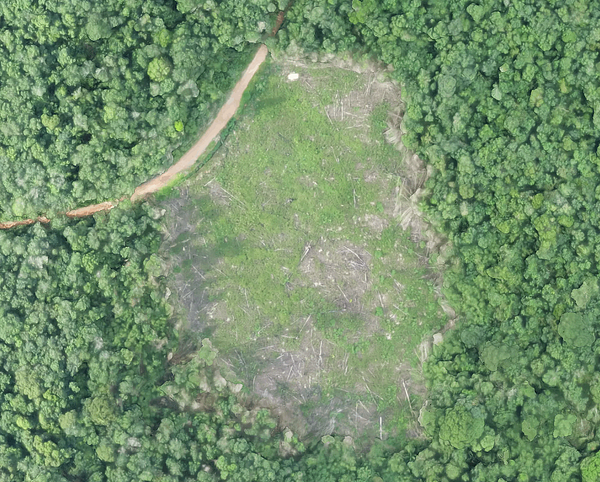
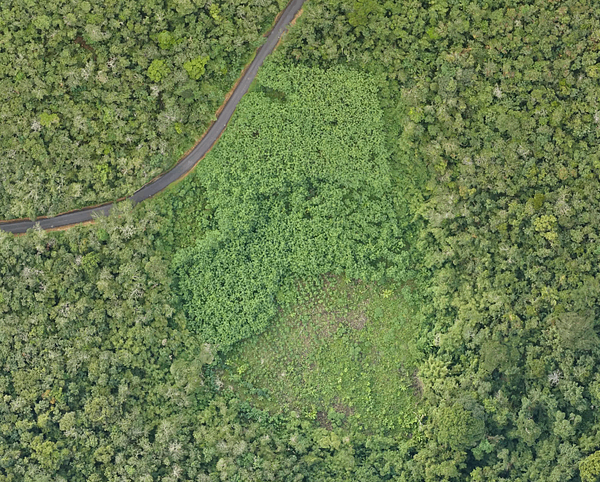
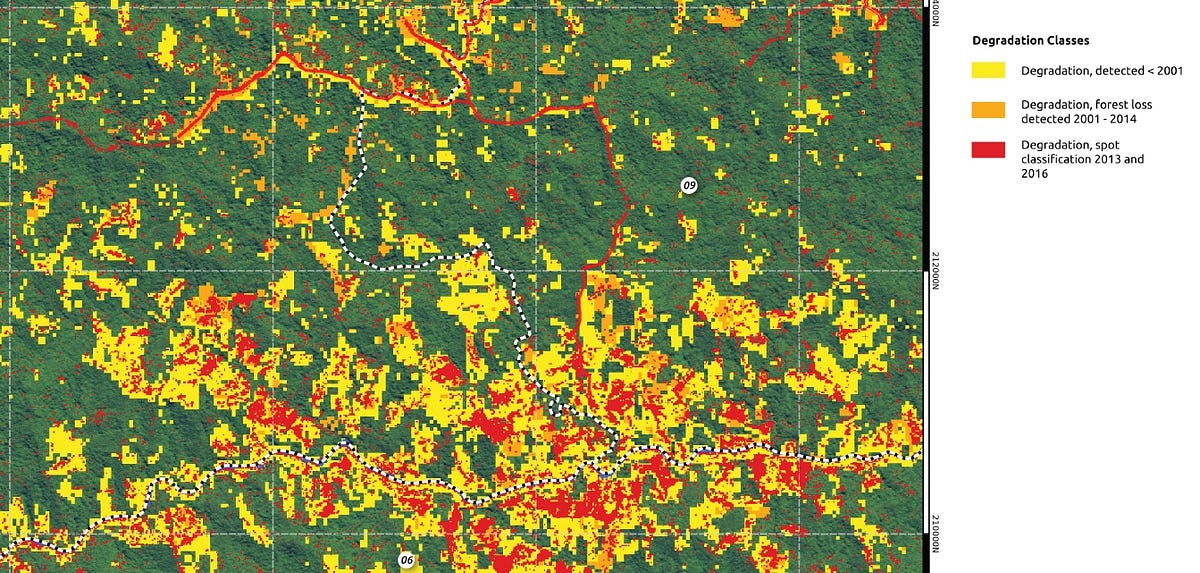
- Detection of human-caused disturbances like encroachment and illegal logging
- Monitoring of the logging impact
- Determination of areas with plant stress
- Stratification of productivity zones
- Fire threat and fire detection
- Pest and disease spread
- Wildlife observation
For someone, who is not working on a daily base with remote sensing data, the big number of data sources, their specifications and the multitude of potential analysis can be quite challenging. The following questions will help to specify your information requirements and condense the potentially available data sources:
- What do I want to observe?
- What is the spatial size and distribution?
- What is the frequency of my information requirement?
- What is the required minimum time resolution and accuracy?
- What are the costs?
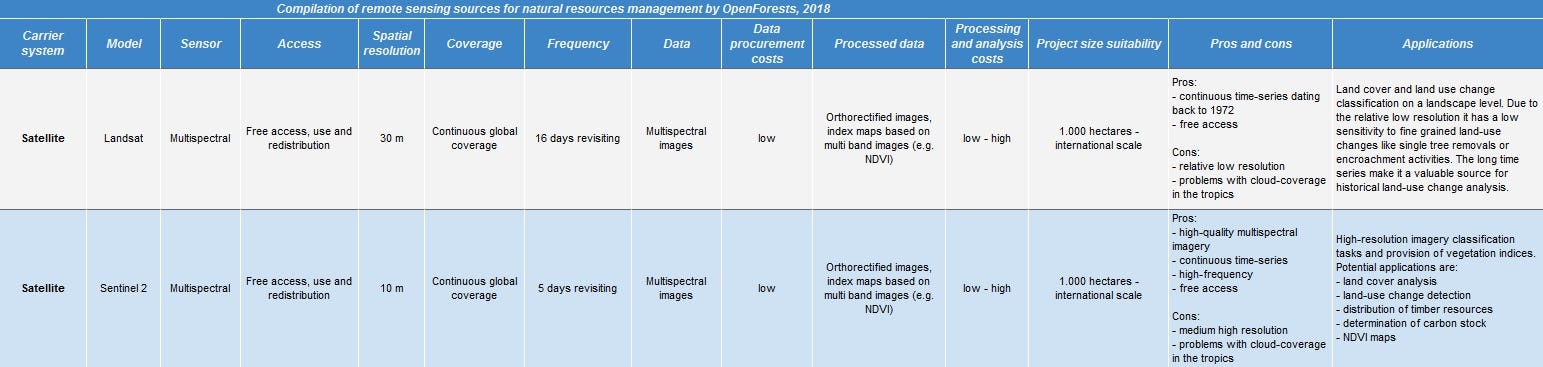
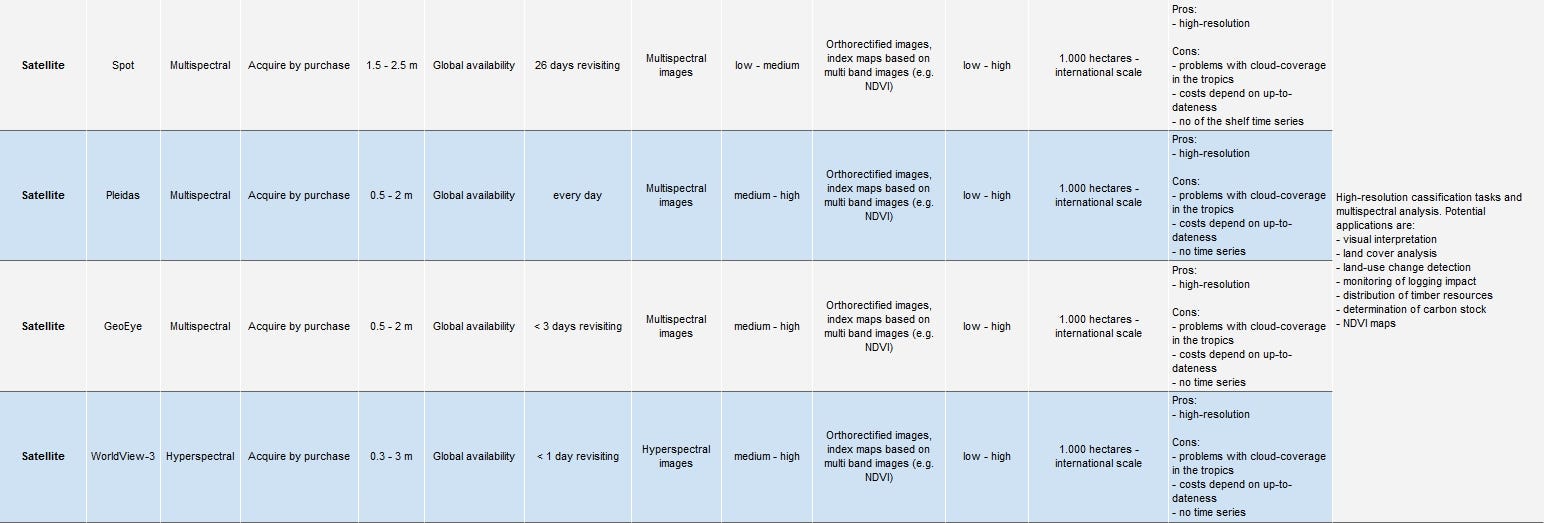
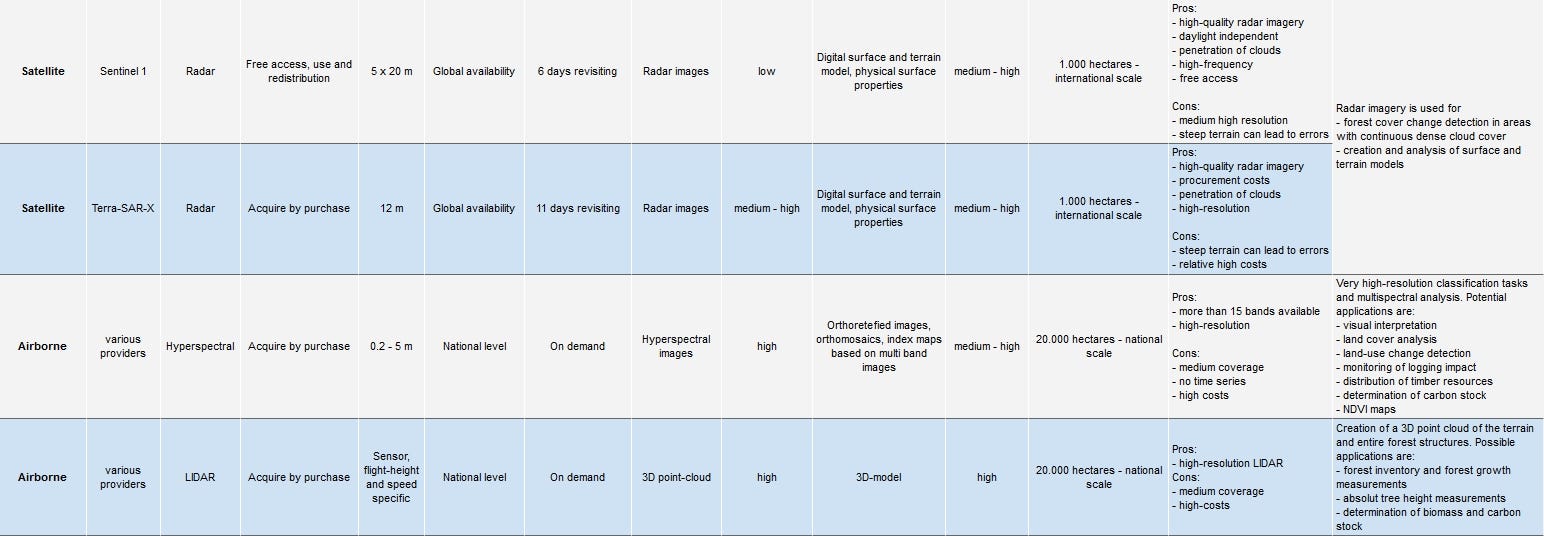
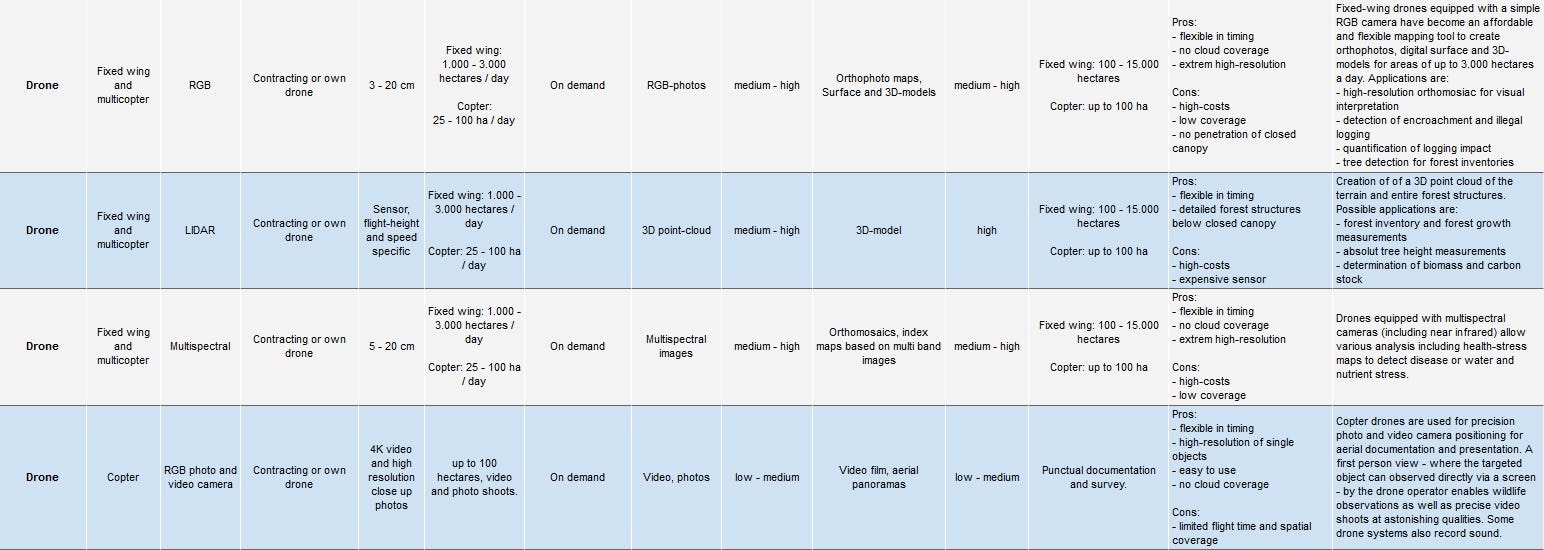
Remote sensing data sources
We have compiled the following list as a decision matrix to help to guide your decision based on the above five questions.Remote sensing data sources and specifications
Link to spread sheet (by OpenForests)
Use Cases
On the example of different use cases, we going to discuss the selection of remote sensing data procurement, processing and analysis.
The following link guides you to the use cases. This is a continuously growing list. Make sure to check it from time to time:
Use cases: https://openforests.com/portfolio/
We are fully aware that this article is just an introduction to the field of remote sensing for natural resources management. However, we are eager to share more and more lessons learned.


